Forbes Research
Designing the system behind a multiplatform research initiative.
5
My Role
As Design VP of the Forbes Content & Design Studio, I owned the creative strategy and direction, set the design principles and system, and led the team that brought it to life across landers, articles, reports, social, video and events. This case study walks through how it came together: the opportunity I framed, the principles I set, the system we stress-tested, and the platforms we launched on.
The Opportunity
Forbes had spent years building a custom research practice for clients, anchored by its C-suite communities. The opportunity was building a Forbes-owned research practice on top of that same audience, across themes that mattered to both readers and advertisers: the CxO Study, sustainability, HNW and luxury, AI, and small business.
Delivering a premium experience across platforms required a design system bold enough to stand out, consistent enough to hold across surfaces, and scalable enough to ship at speed.
Content Strategy, In Partnership
An initiative this scope wasn't a design project alone. I shaped the content strategy in close partnership with Romy Oltuski, who led the editorial team, Ross Gagnon, who led the research team, and Josh Robinson the SVP of the Studio. Together we aligned on which insights would anchor the work, what editorial angles would carry it to audience, and how the design system needed to flex to support both. The principles I'd set for design worked because the content strategy was built alongside them.
Design-Driven Content Experiences
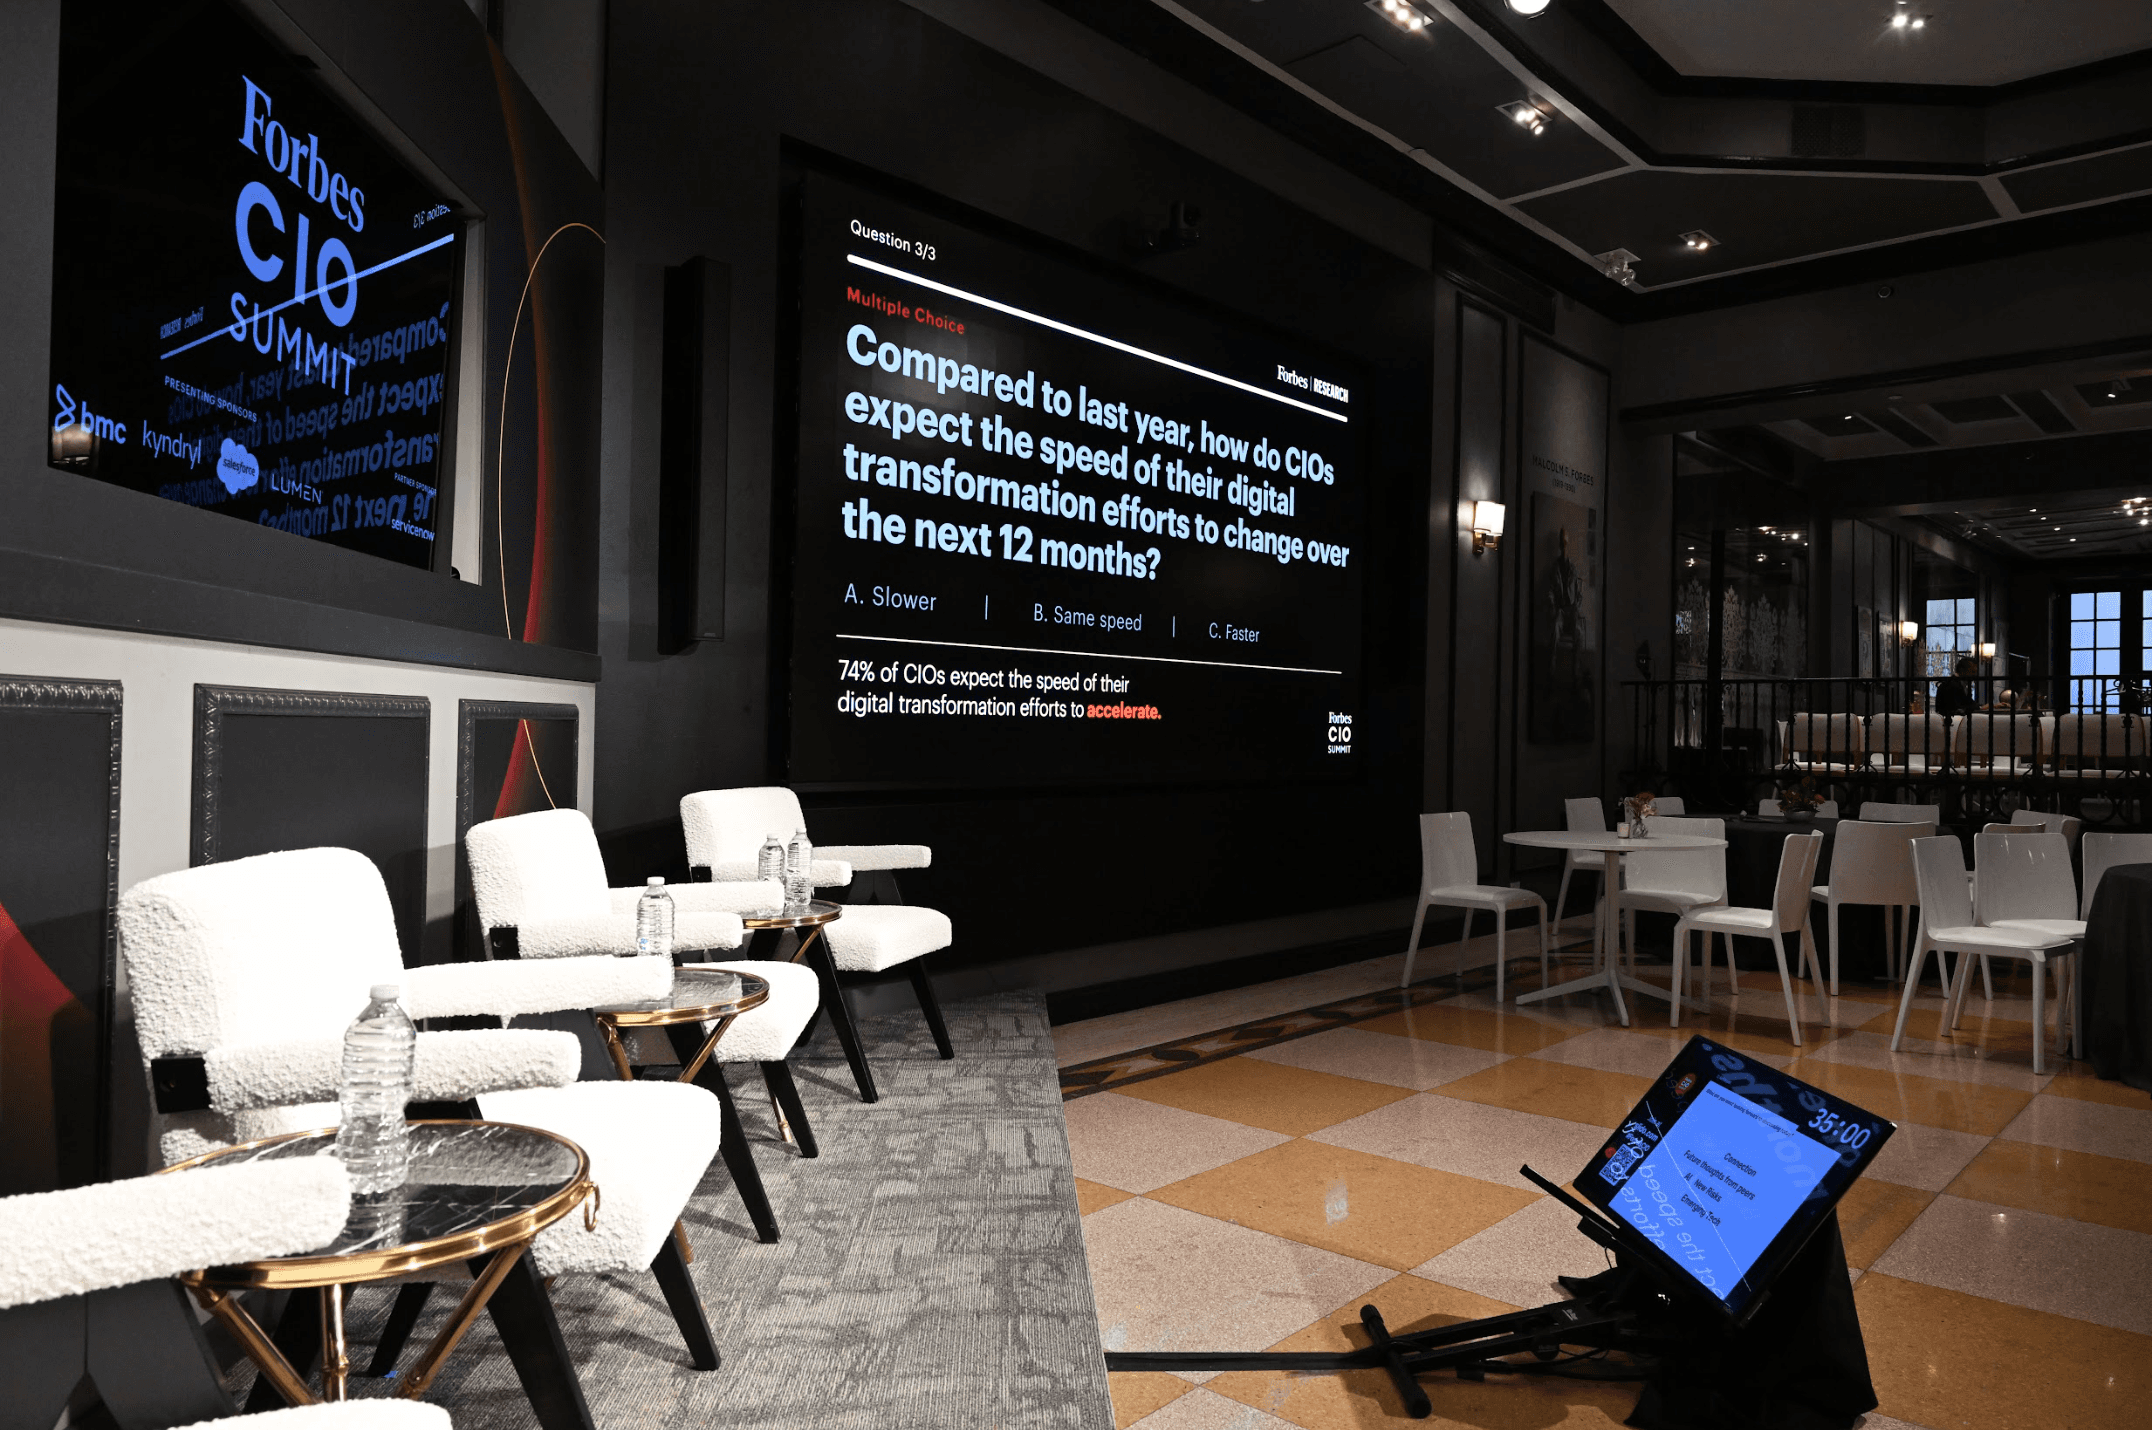
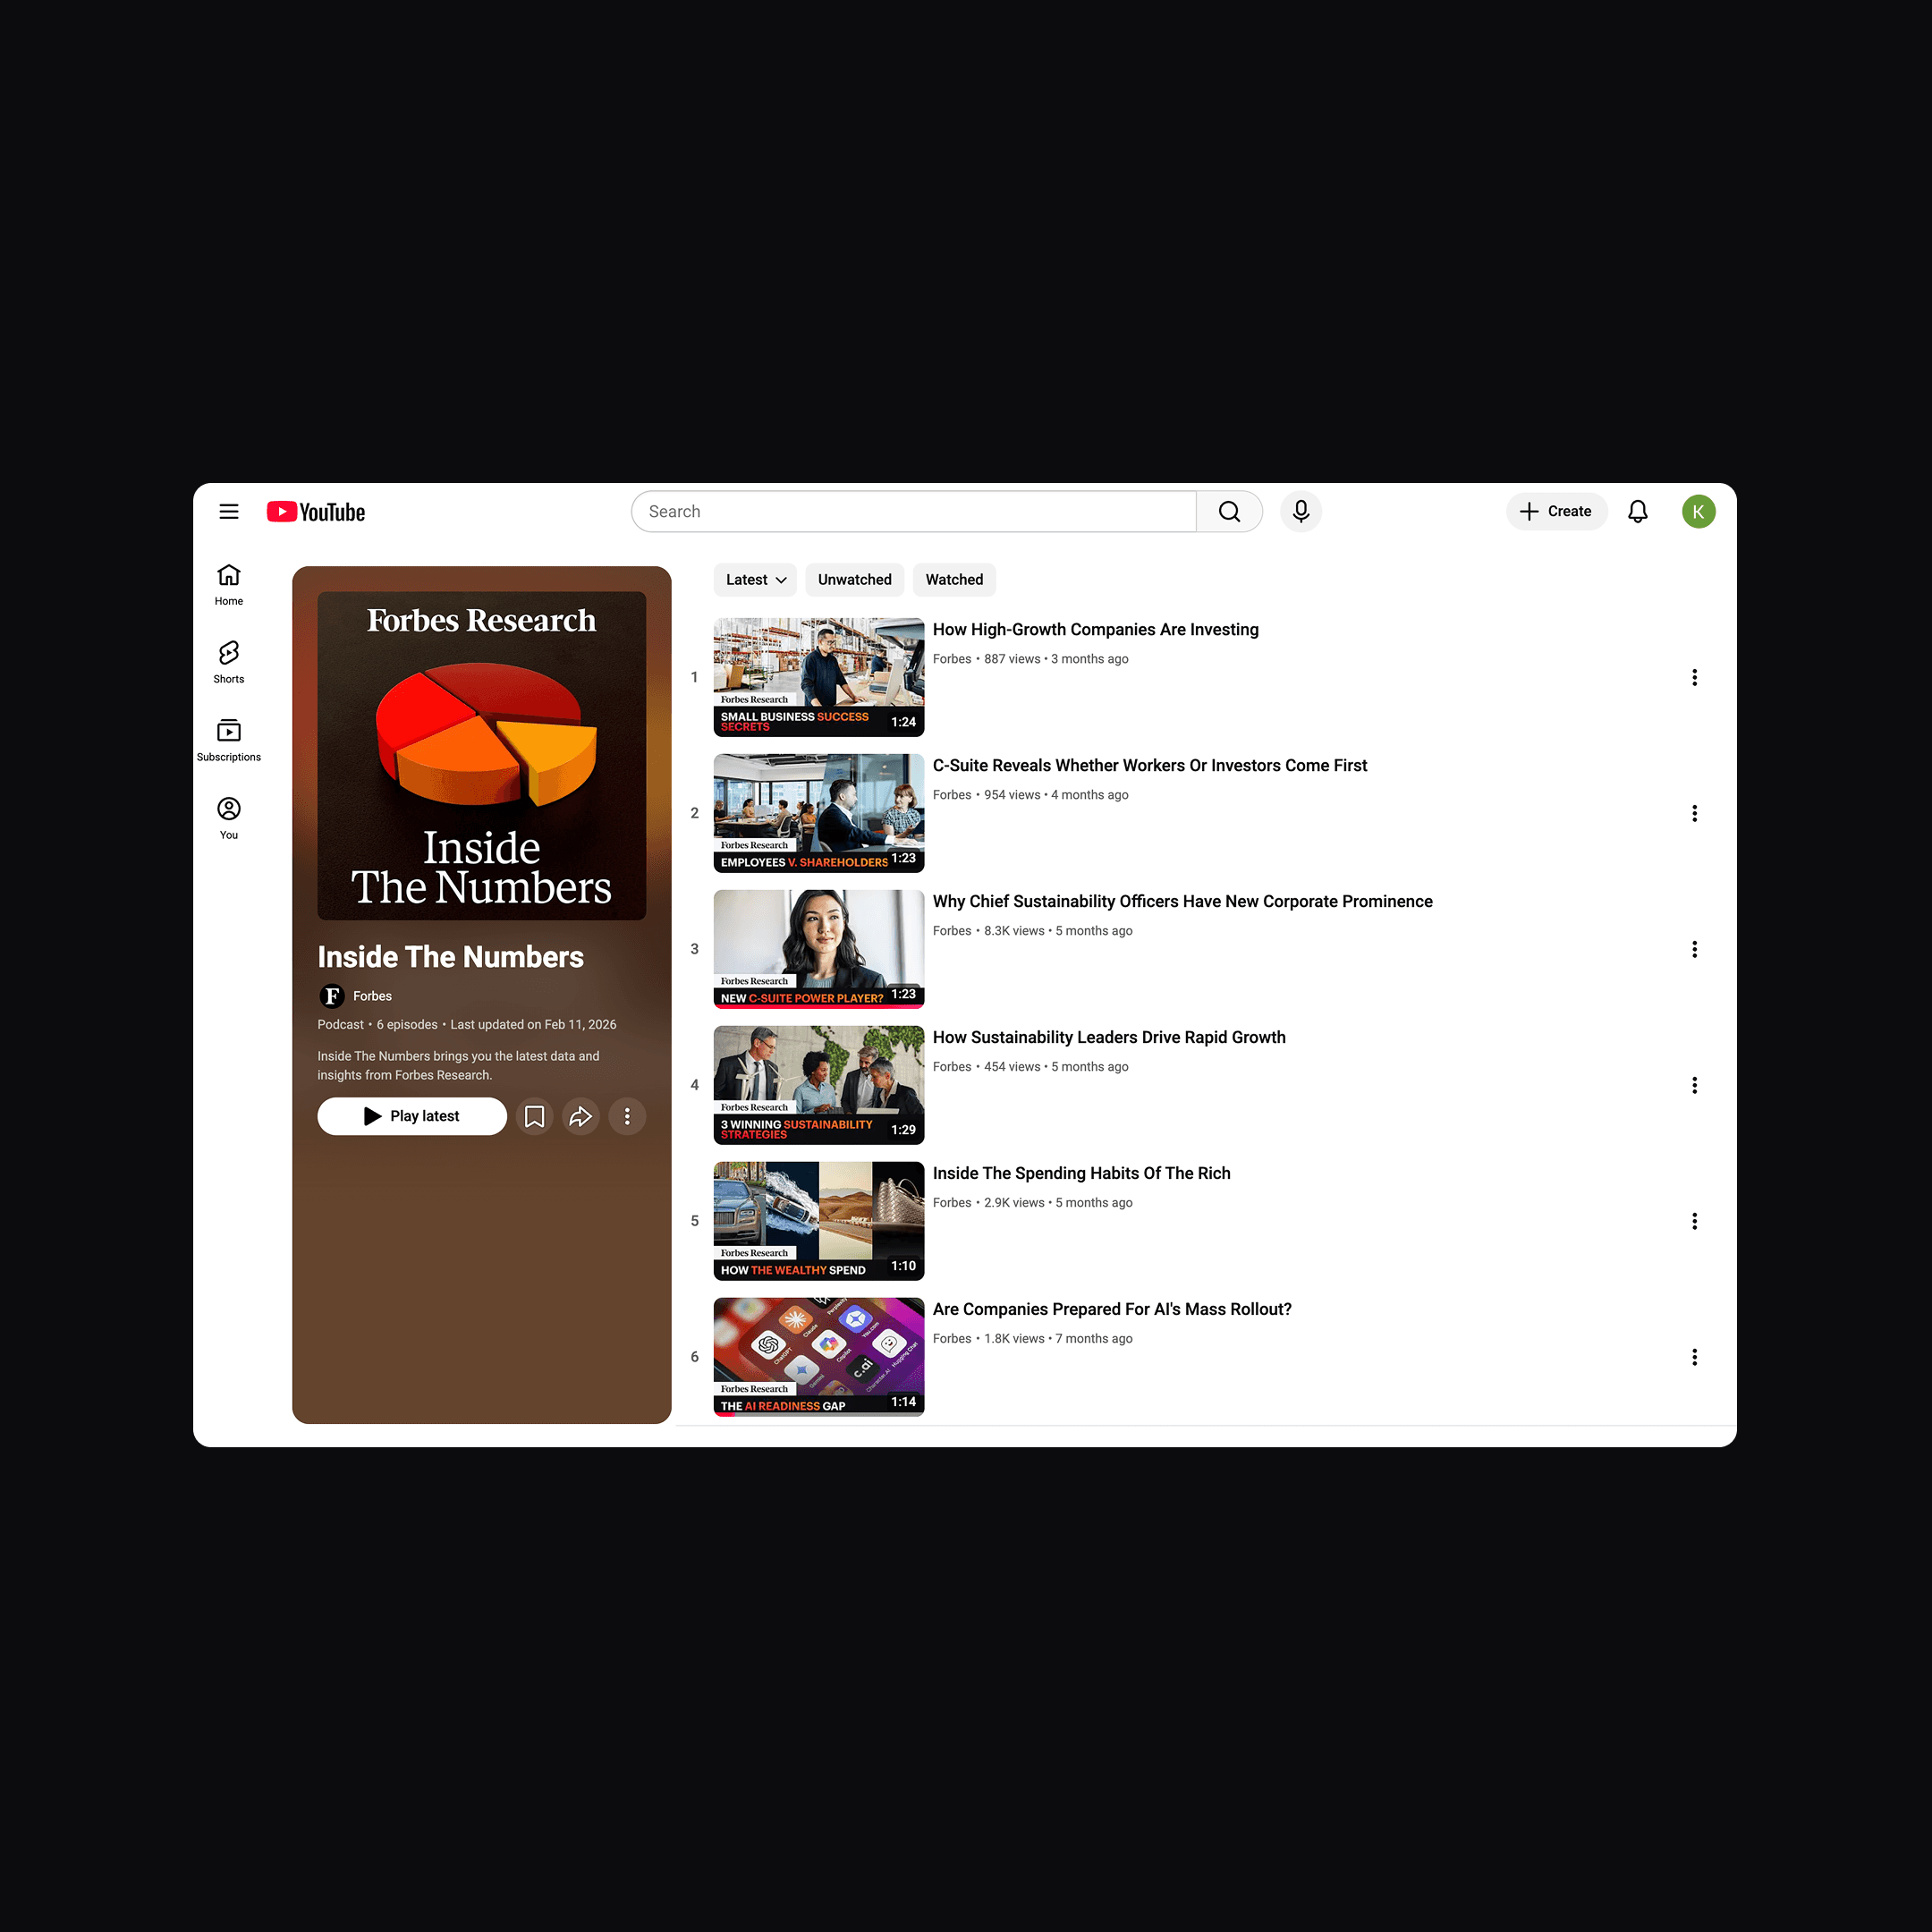
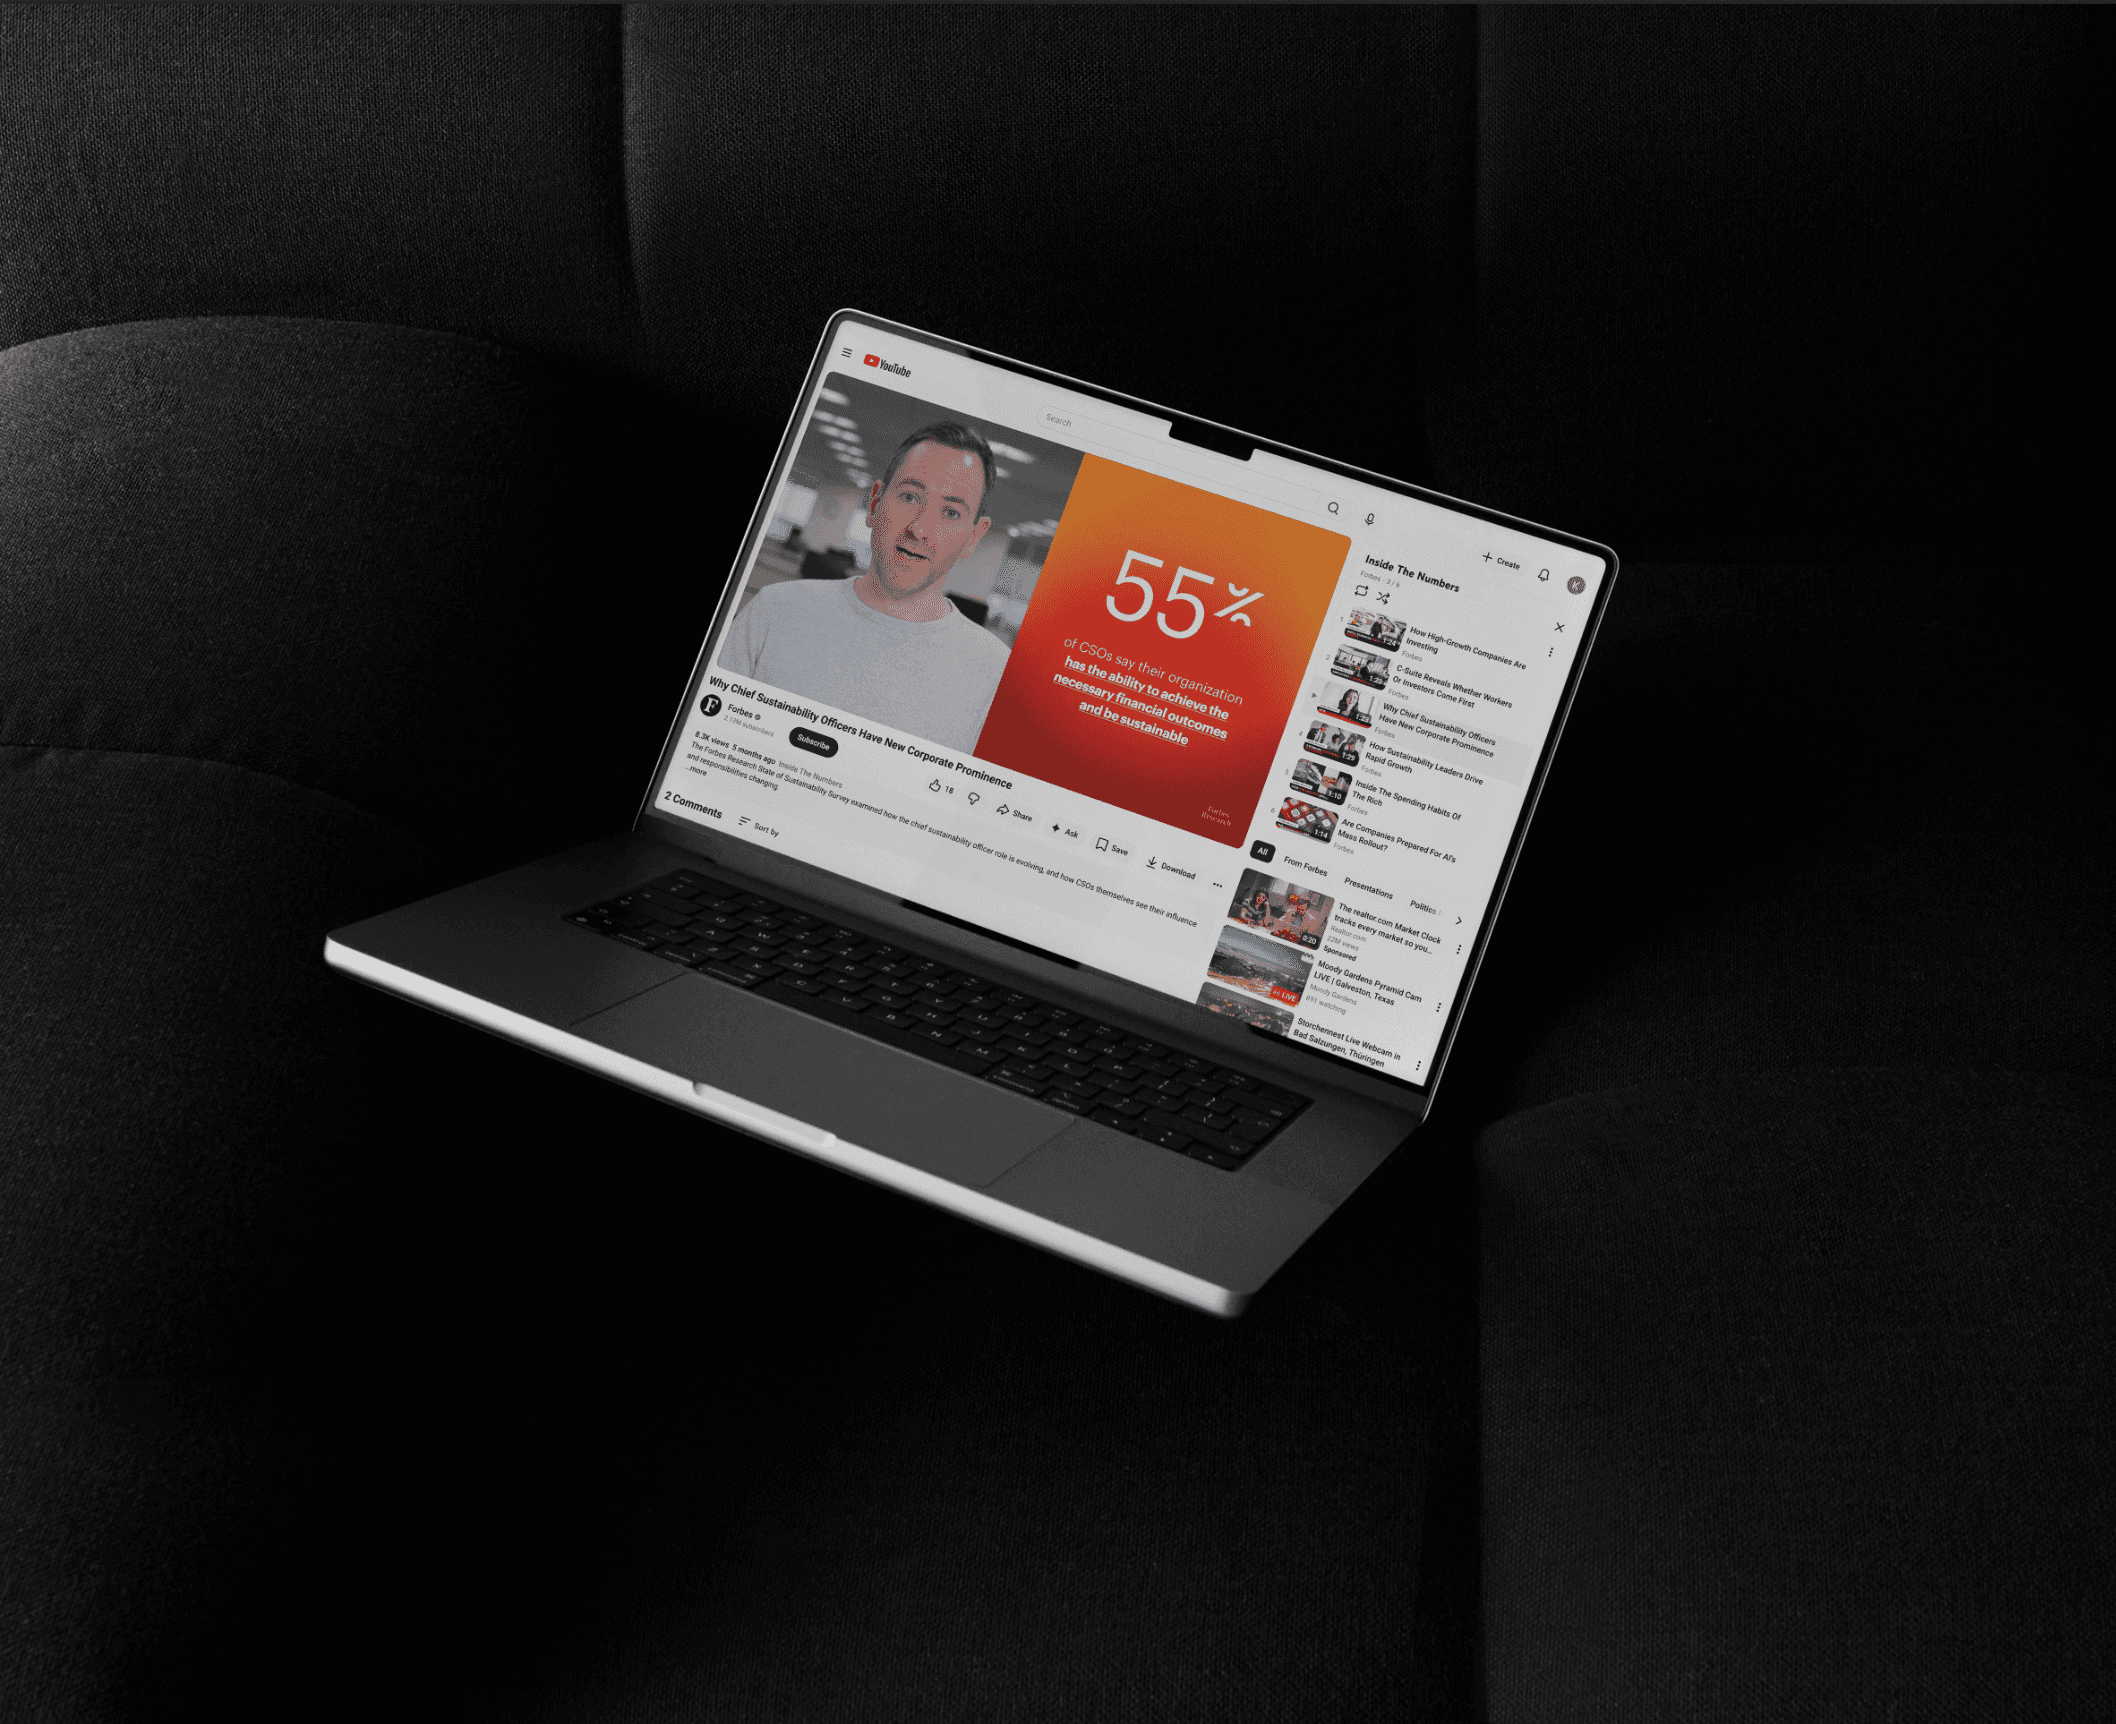
Forbes Research lived on five surfaces: Forbes.com, downloadable reports, social, live executive summits, and a video series.
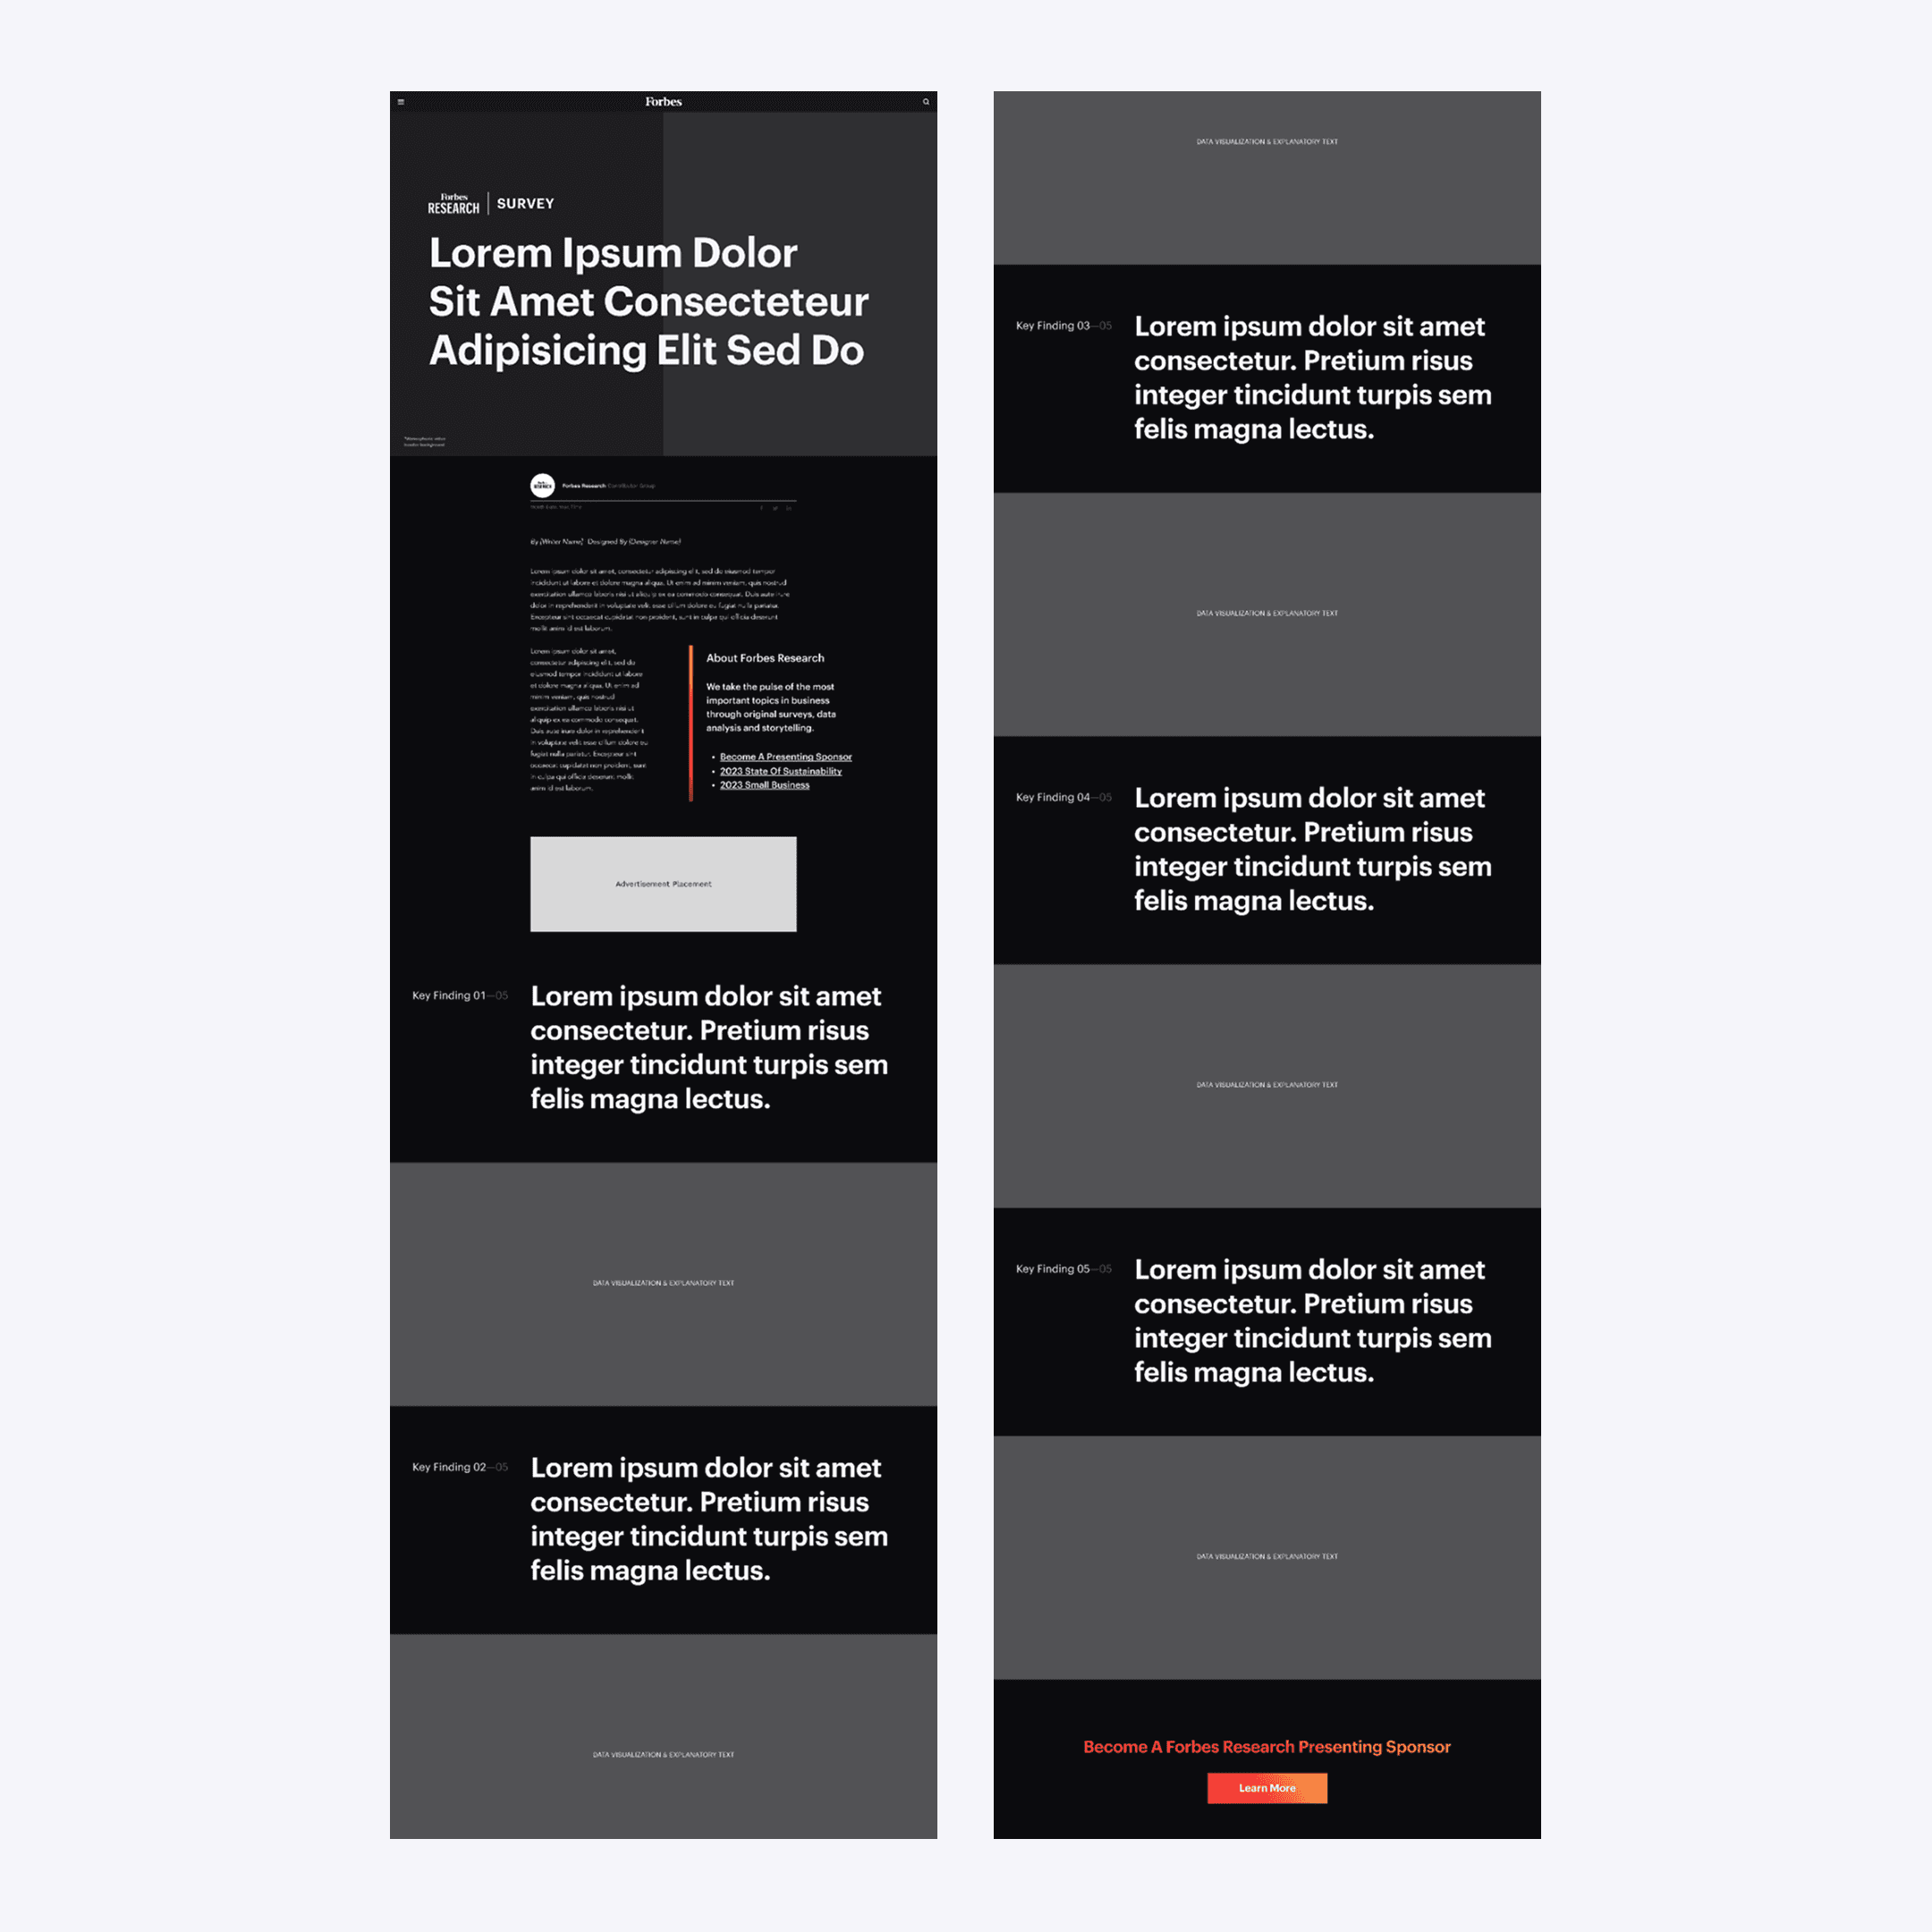
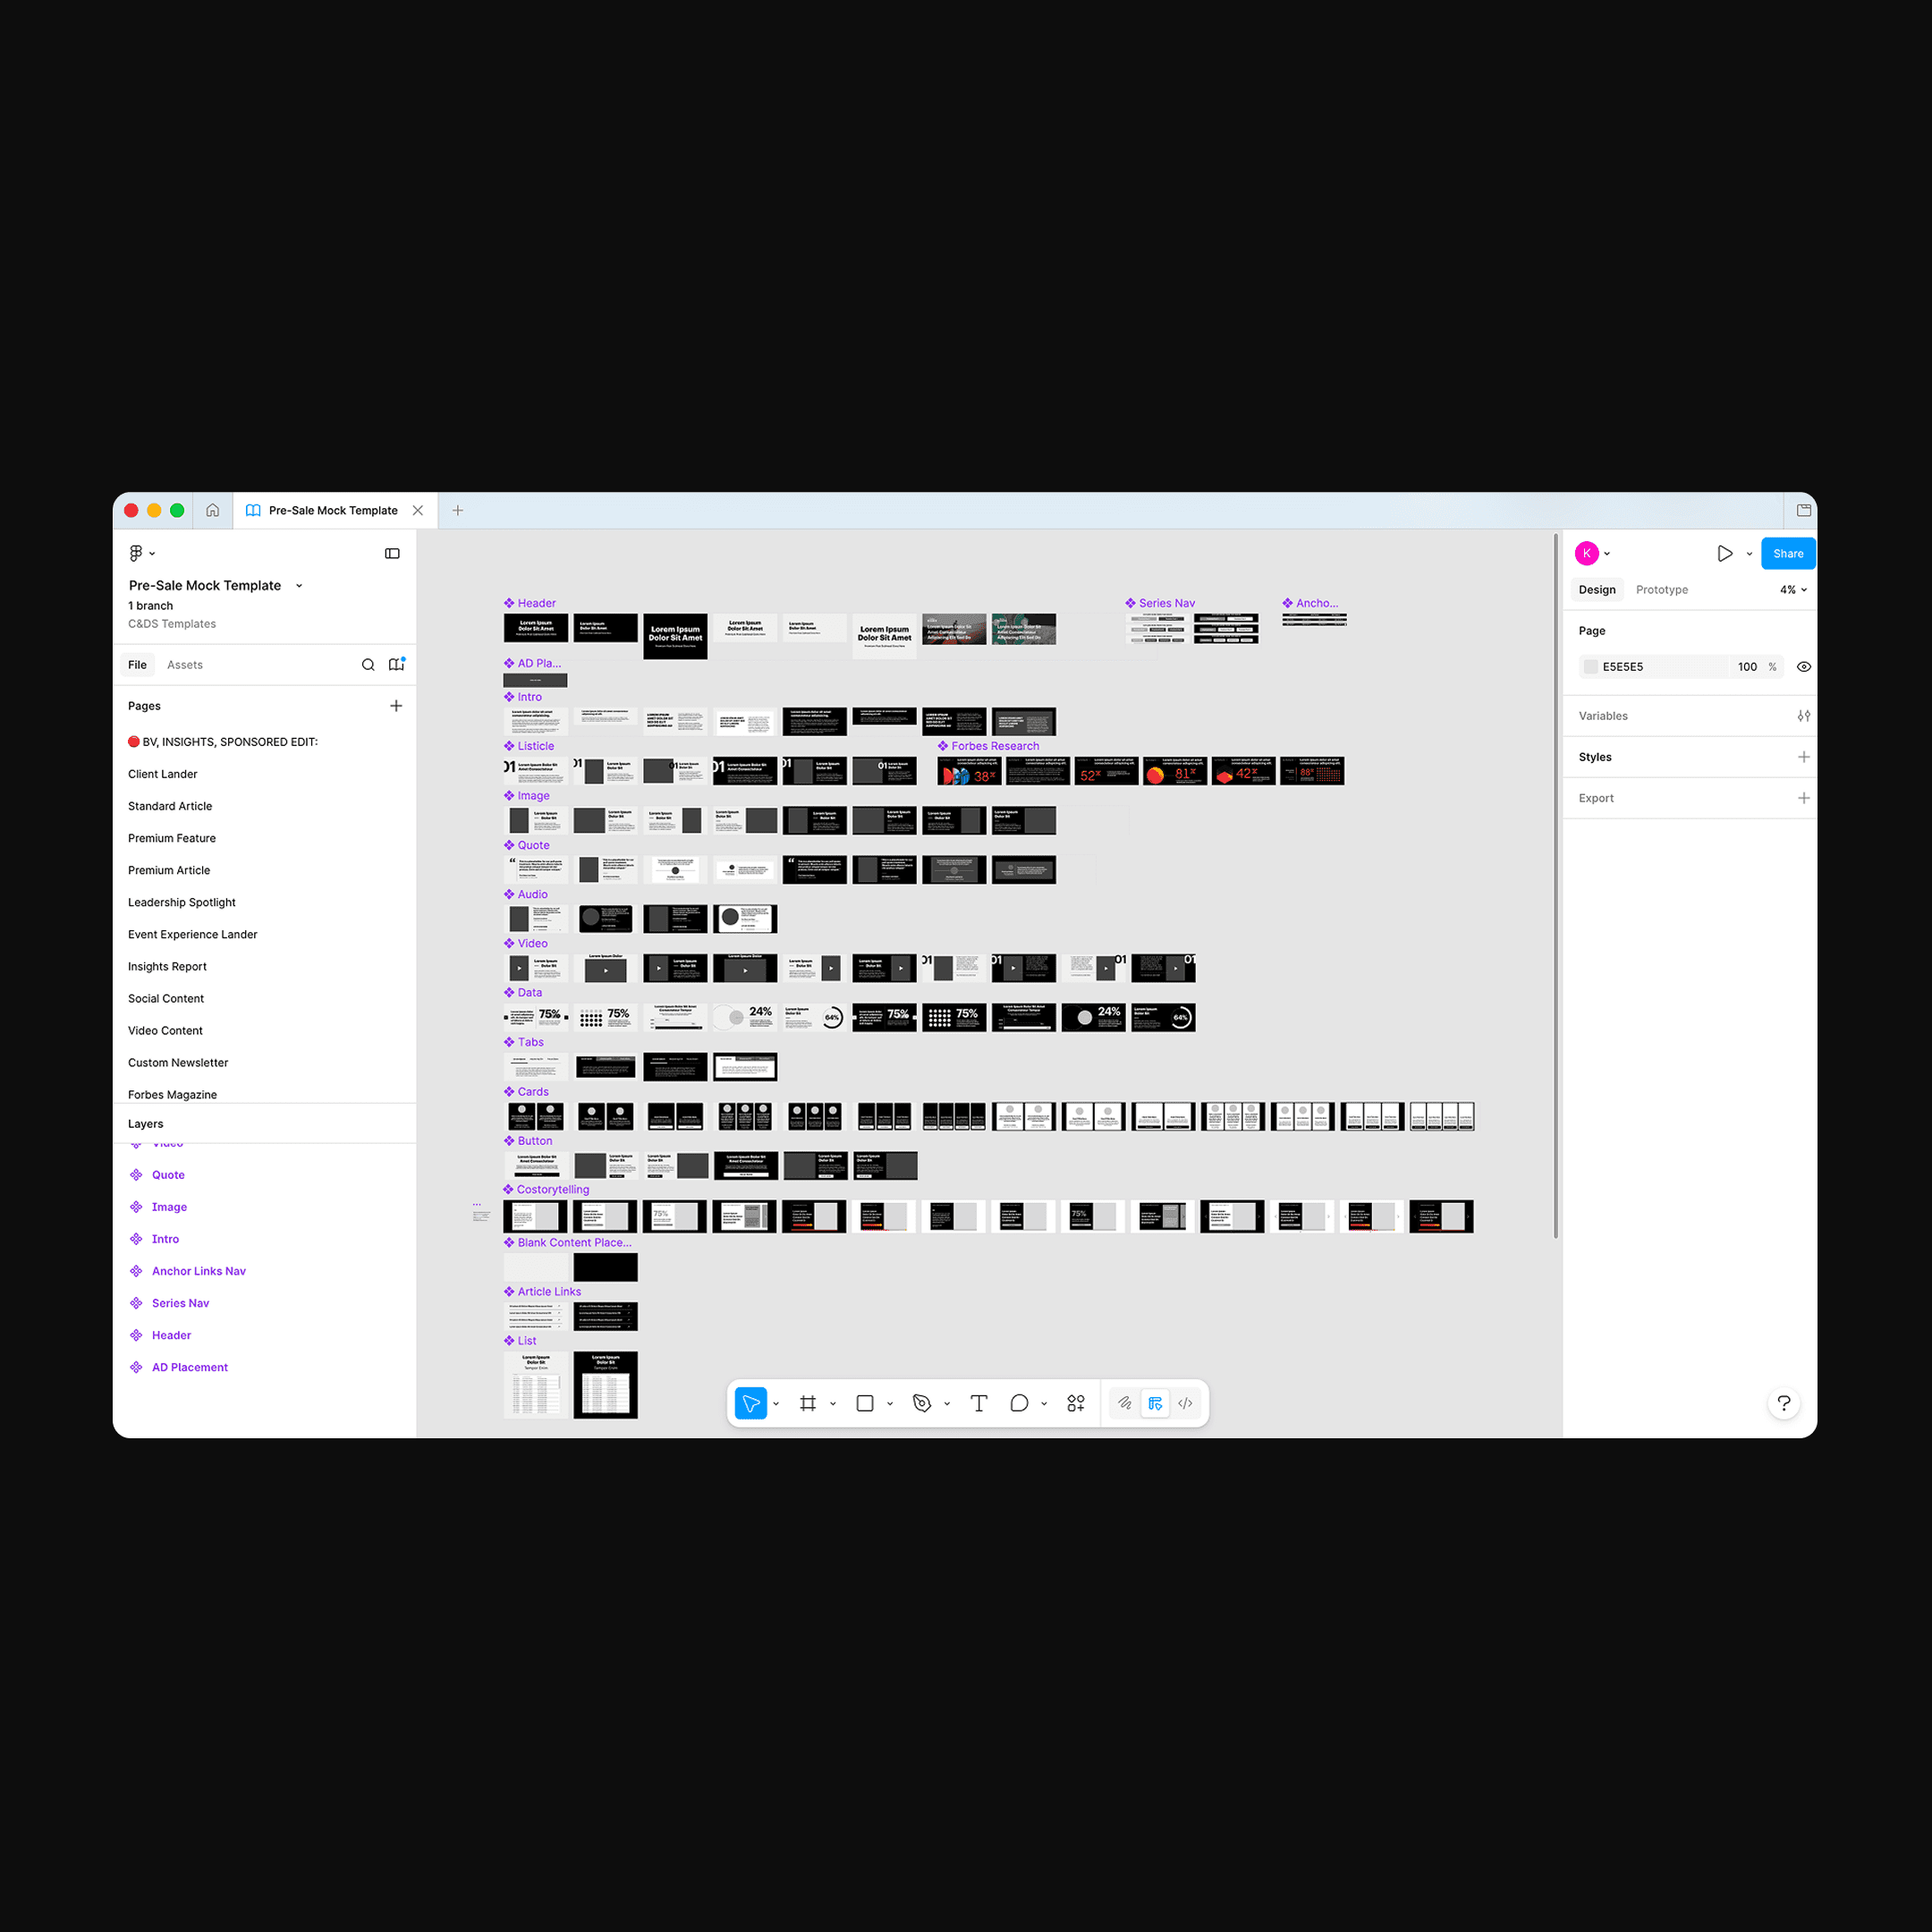
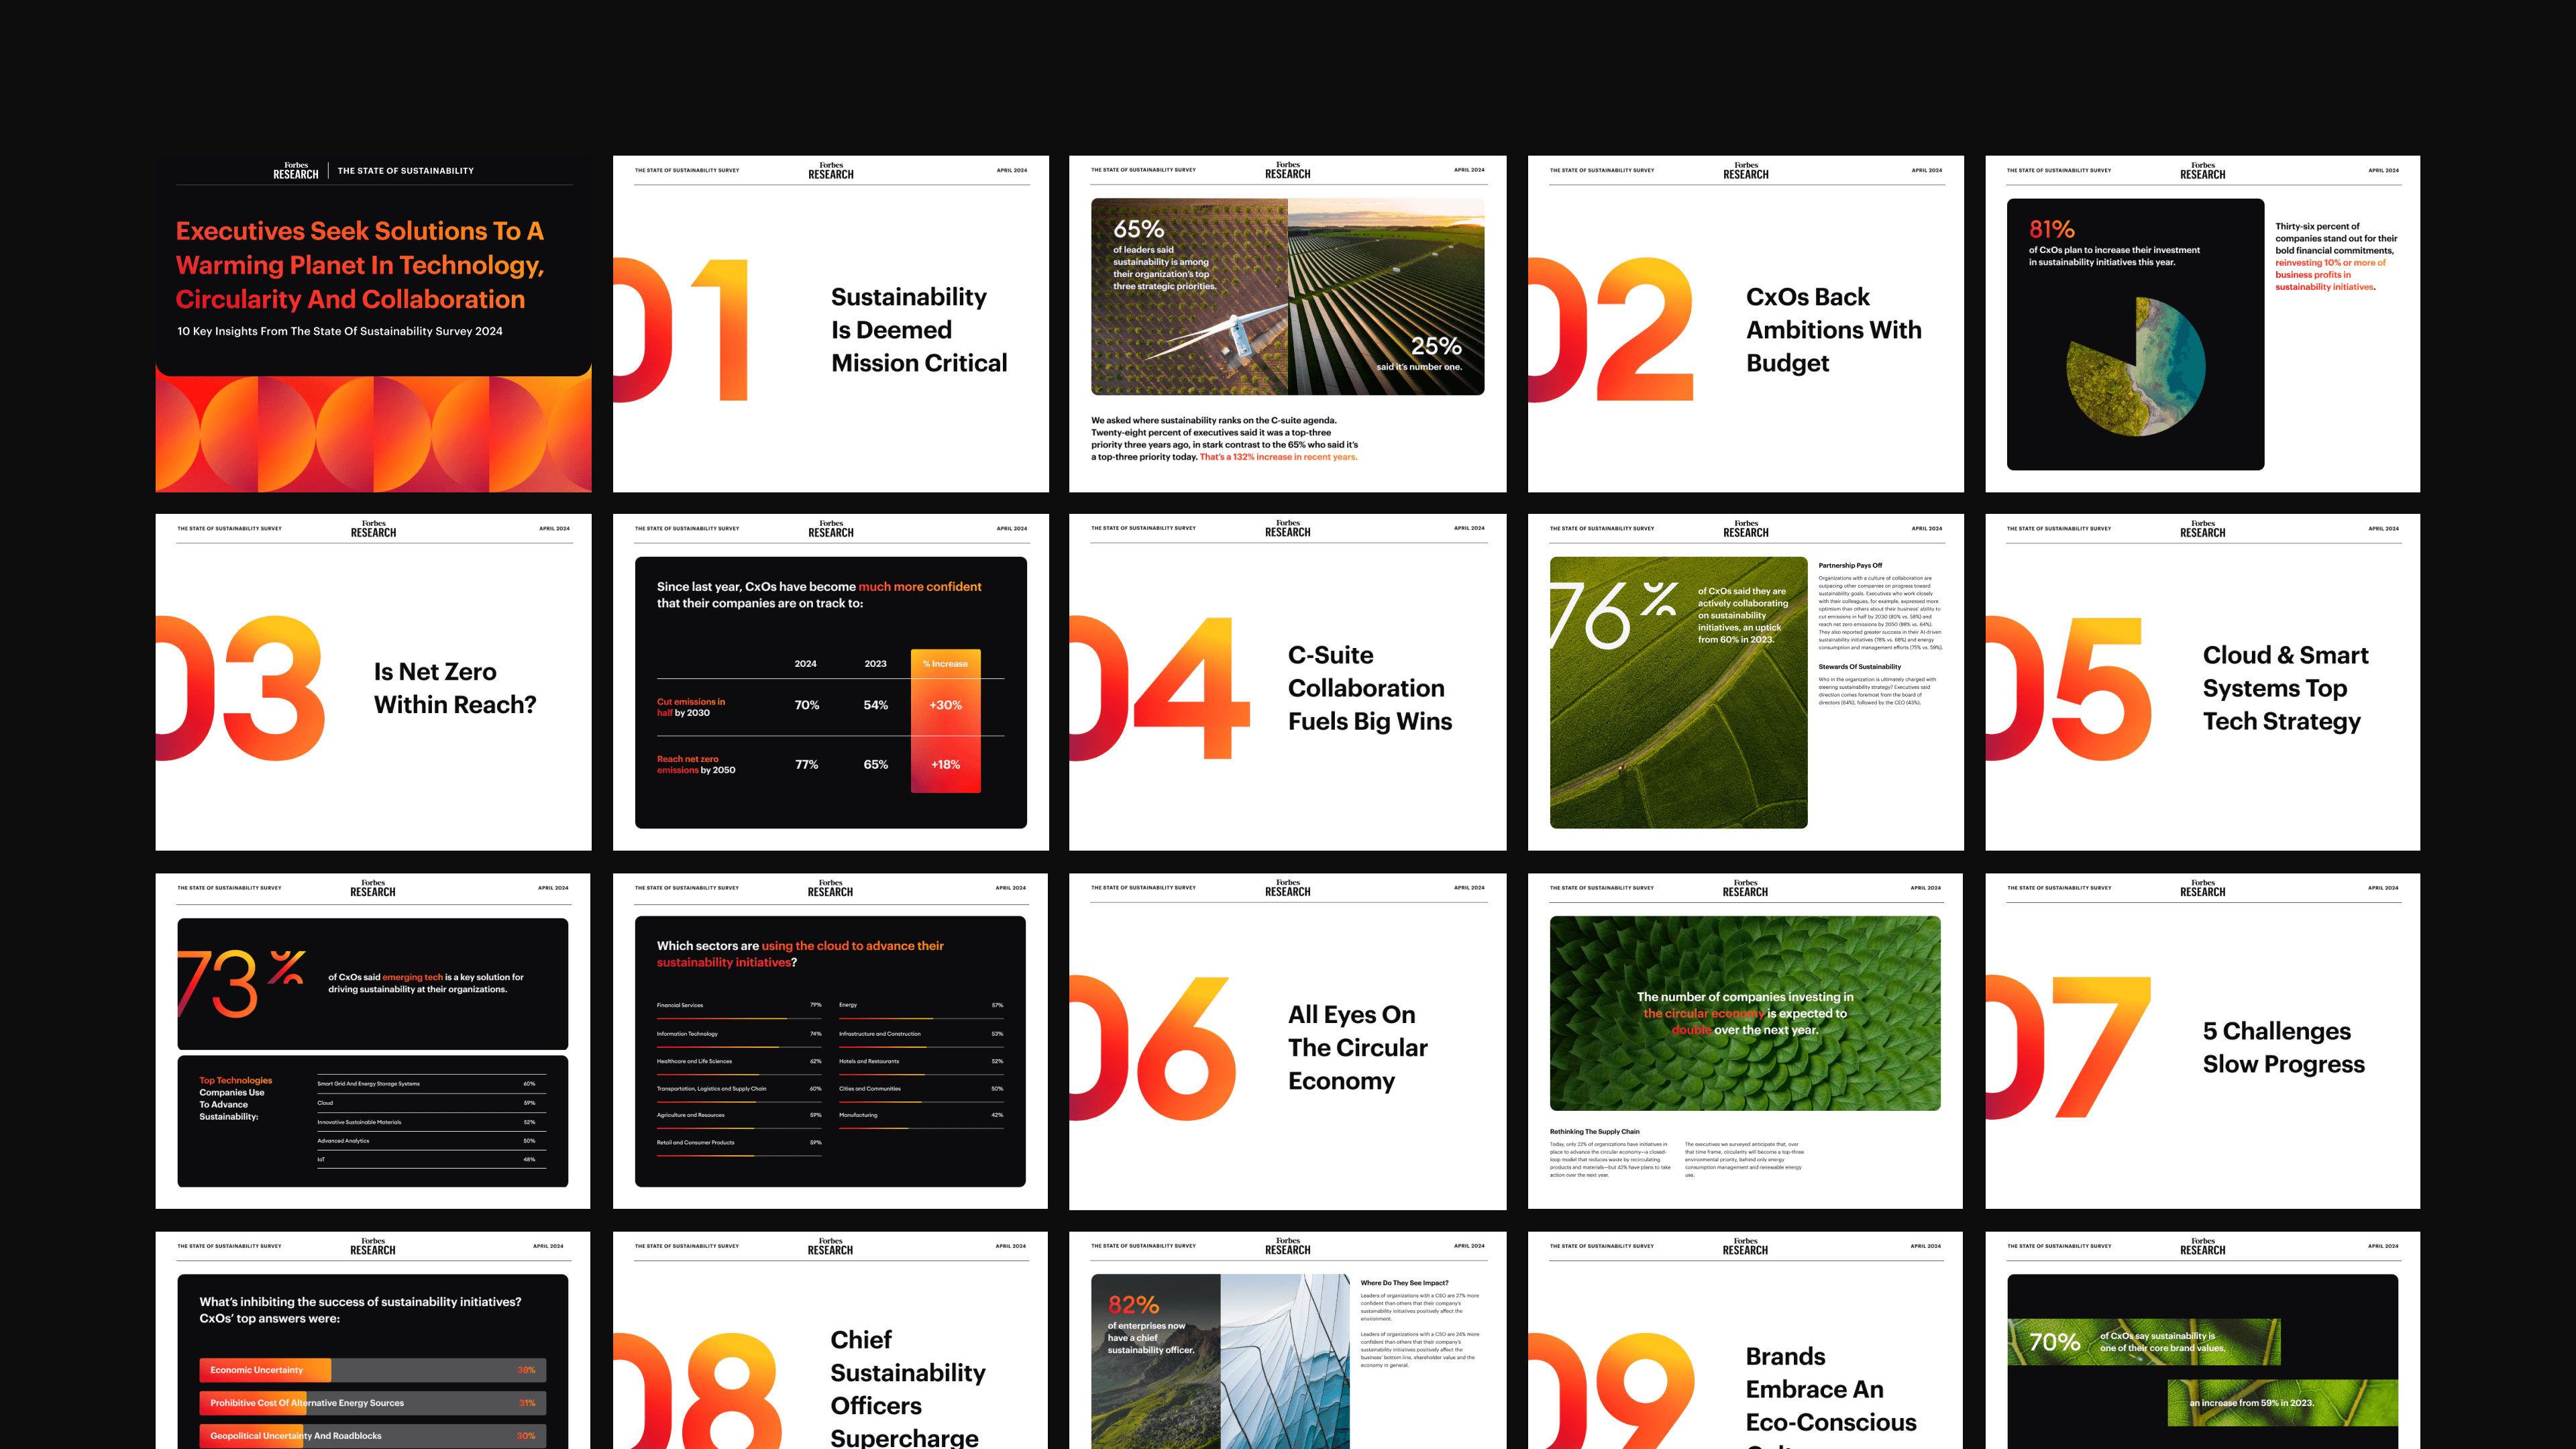
A Scalable Modular System
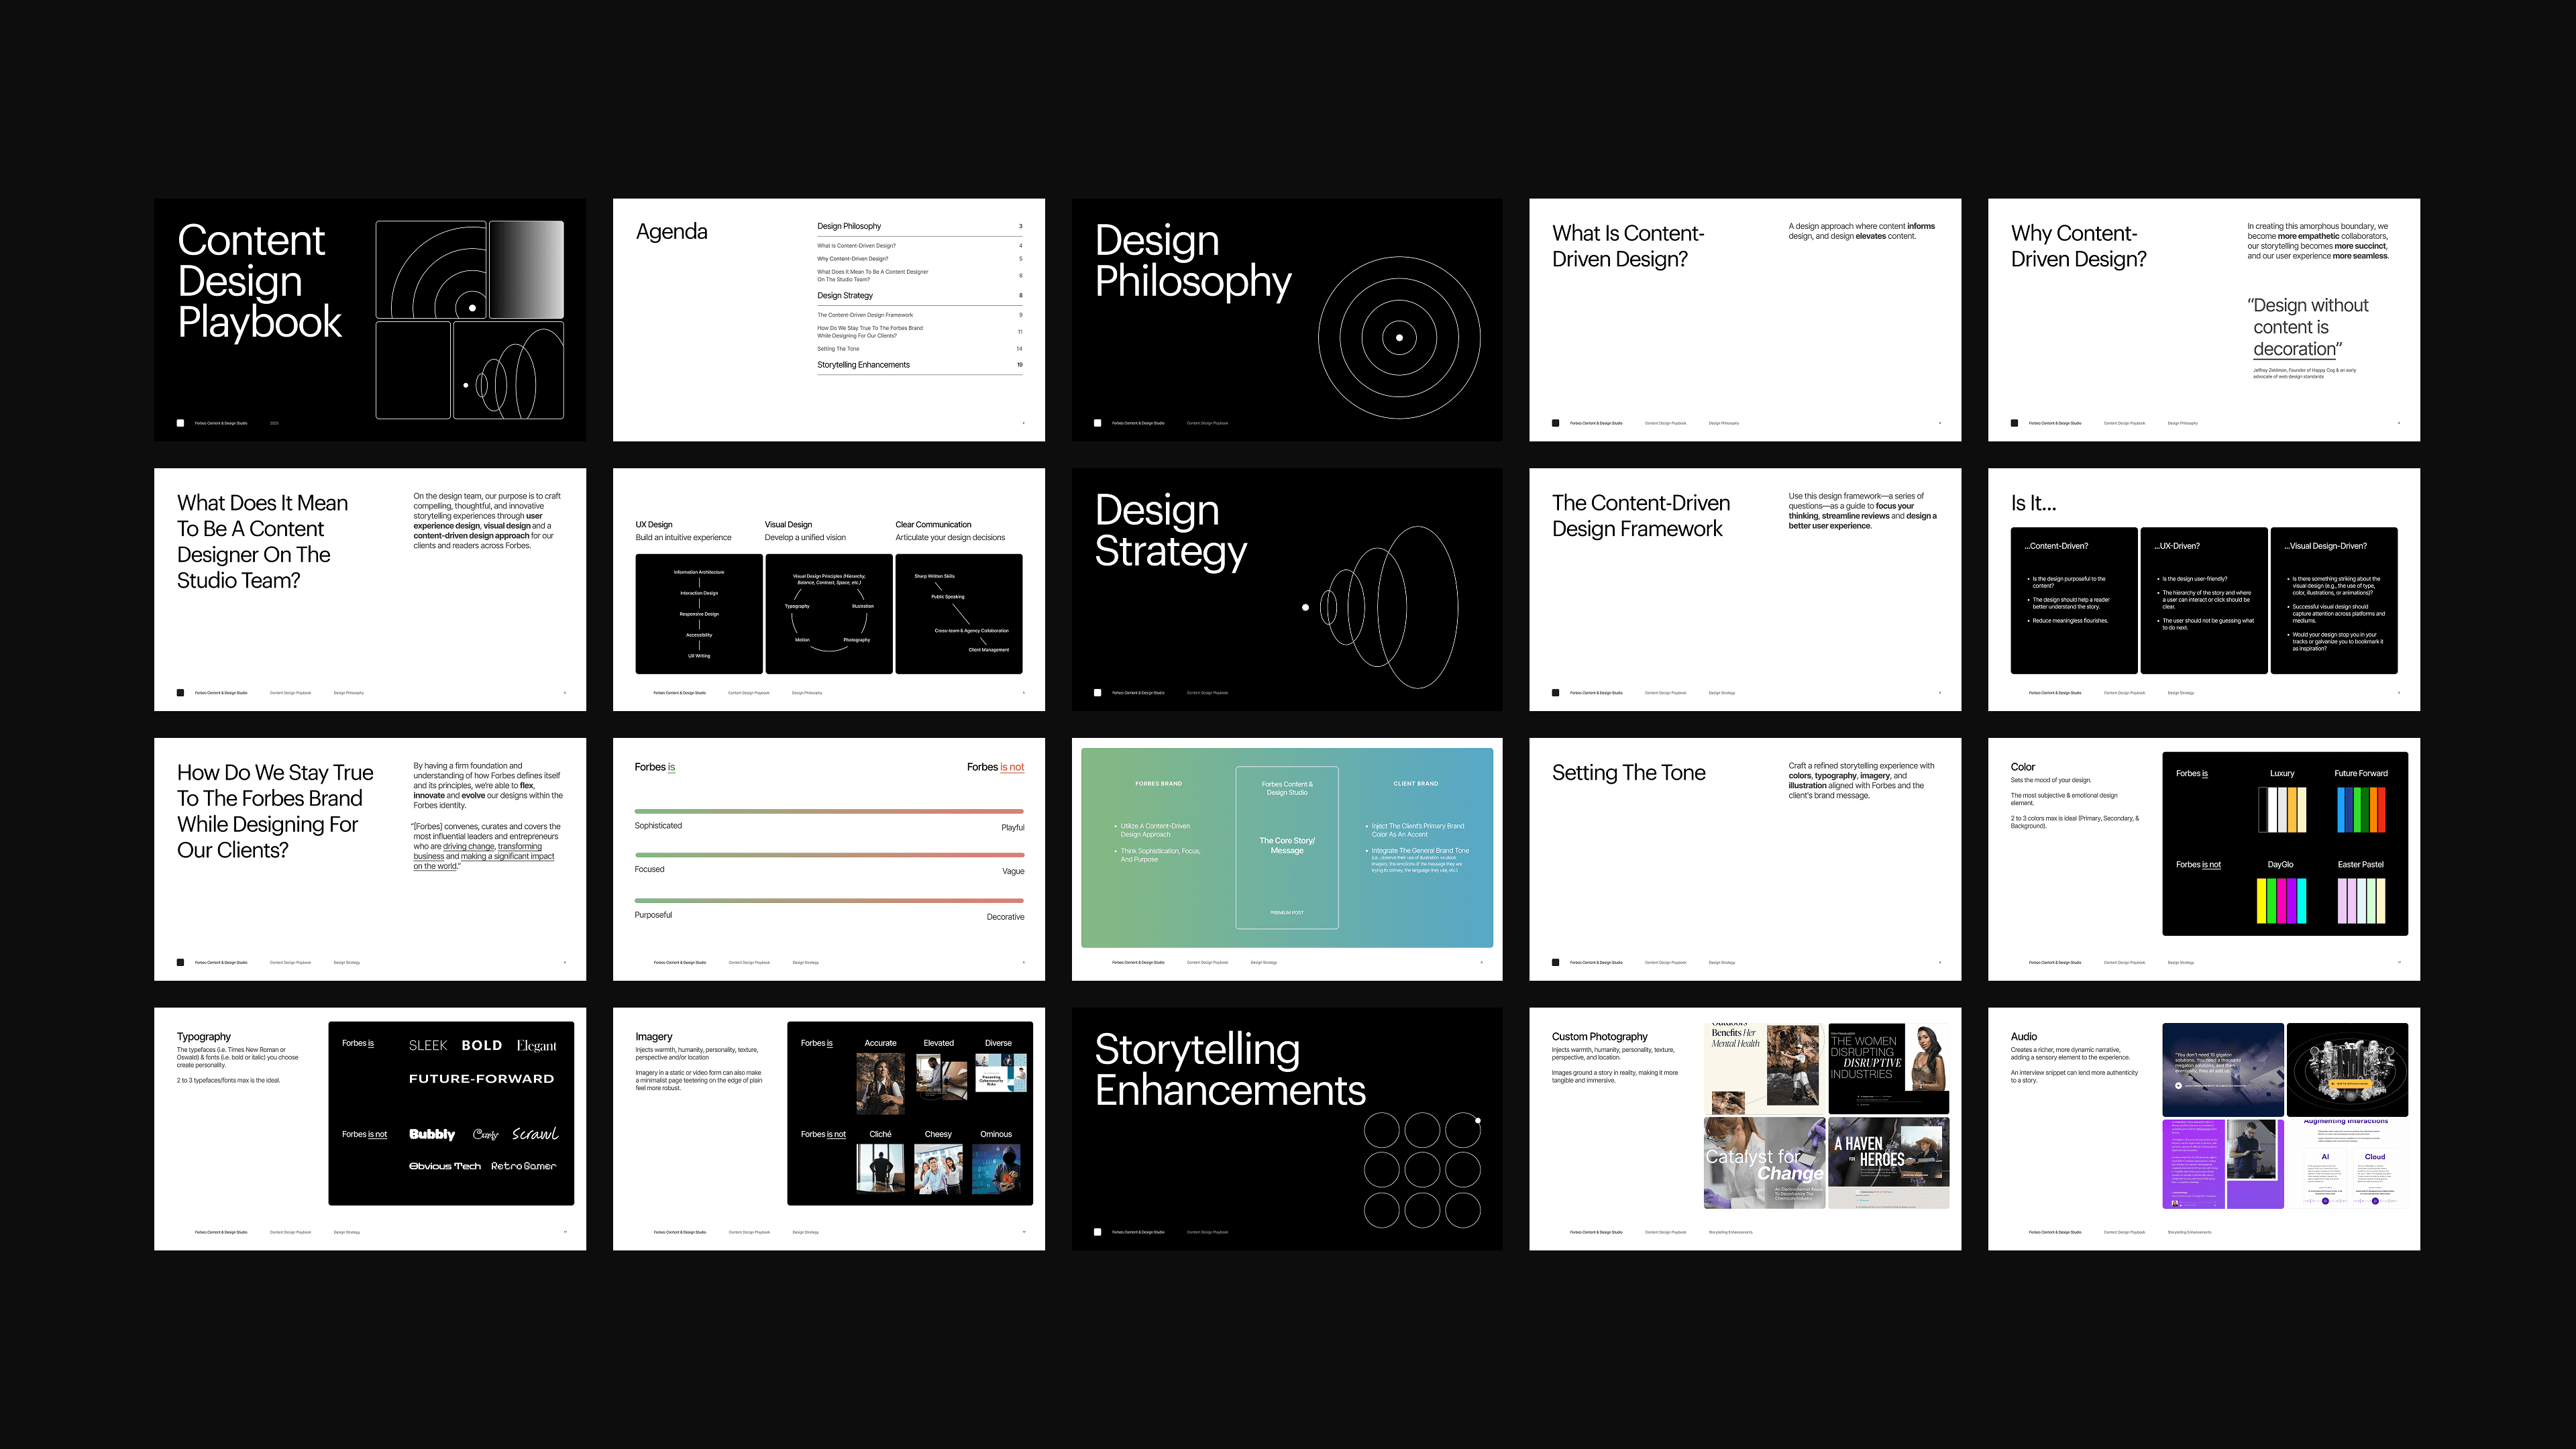
Three principles drove the design system I set for the team.
Premium: Our readers were C-suite executives and business decision-makers, an audience that engaged with premium experiences daily across brands they trust. Design was how Forbes Research signaled rigor, sophistication, and purpose.
Dynamic: The system used motion, rich gradients and imagery, and intentional interaction to make key data points unmissable.
Scalable: The system had to scale across design, editorial, research, social, video, and events teams, all working against fast-paced deadlines. The system had to hold up under that pressure, and it did across 80+ experiences.
Under my creative direction, Janet Yin, the Art Director on my team led the style guide execution, coordinated with the video team, and collaborated with our motion graphics partner, Studio Ianus. Together with the design team we pressure-tested every decision against production reality.
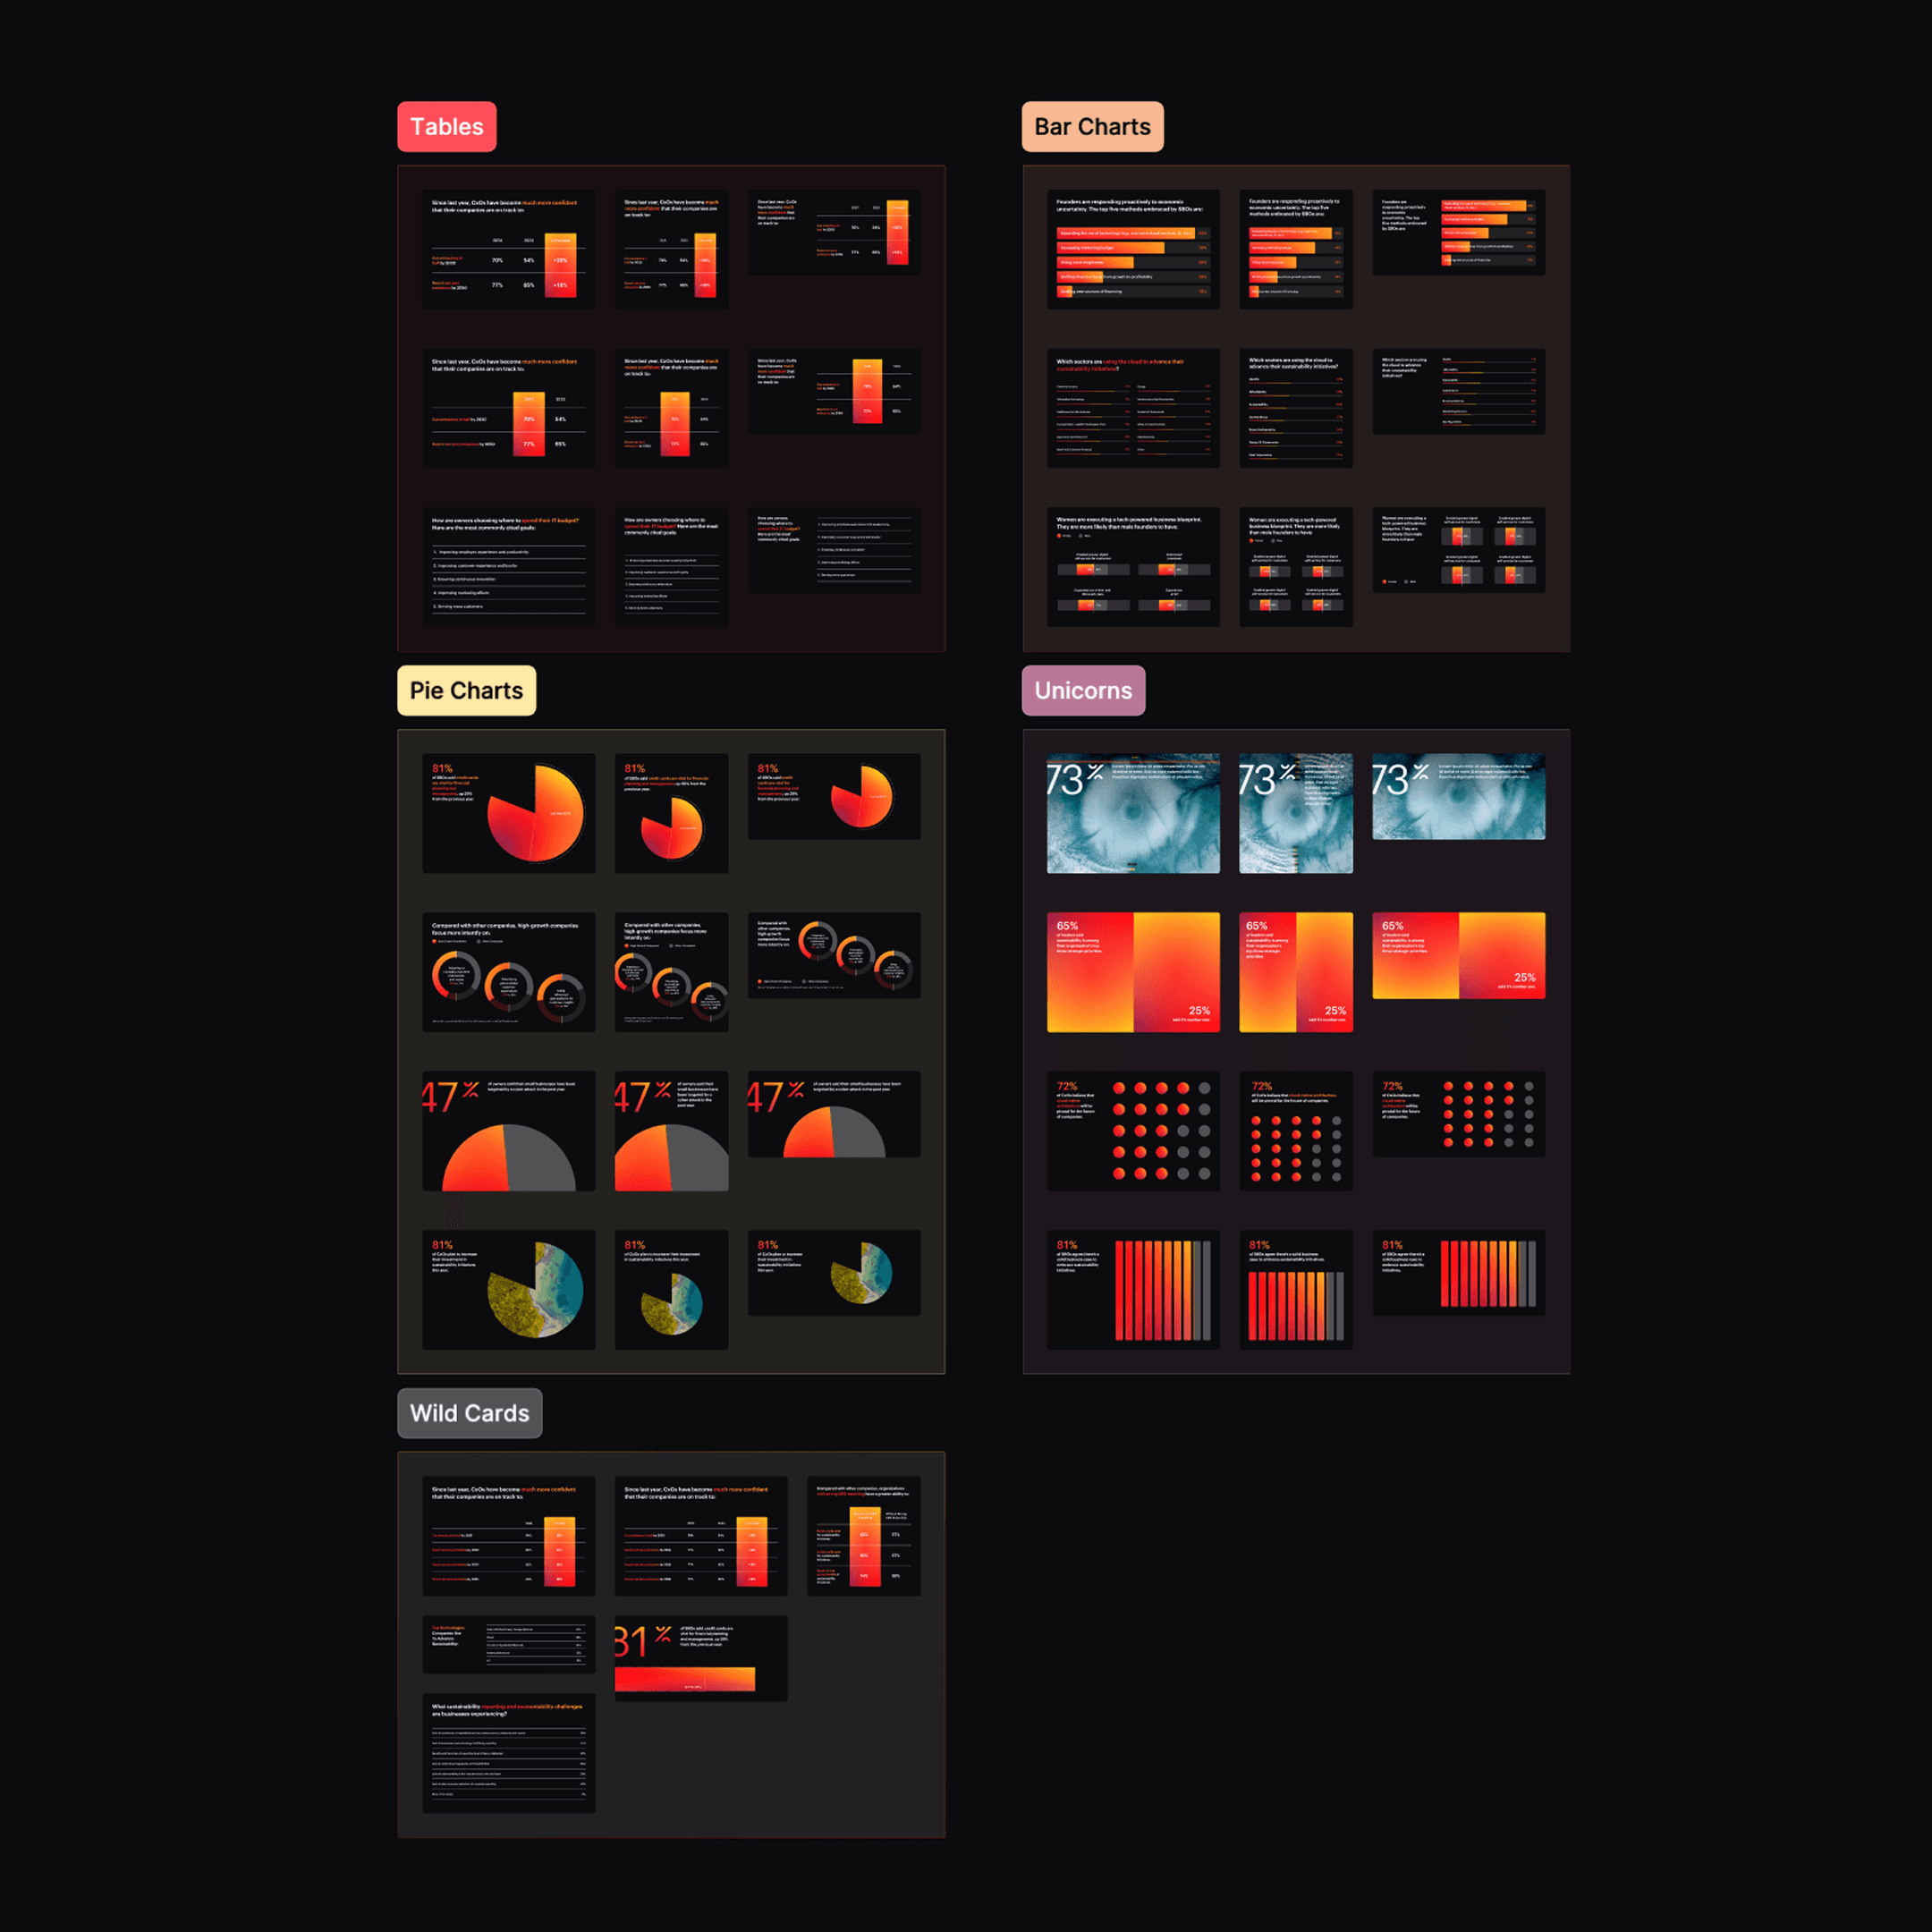
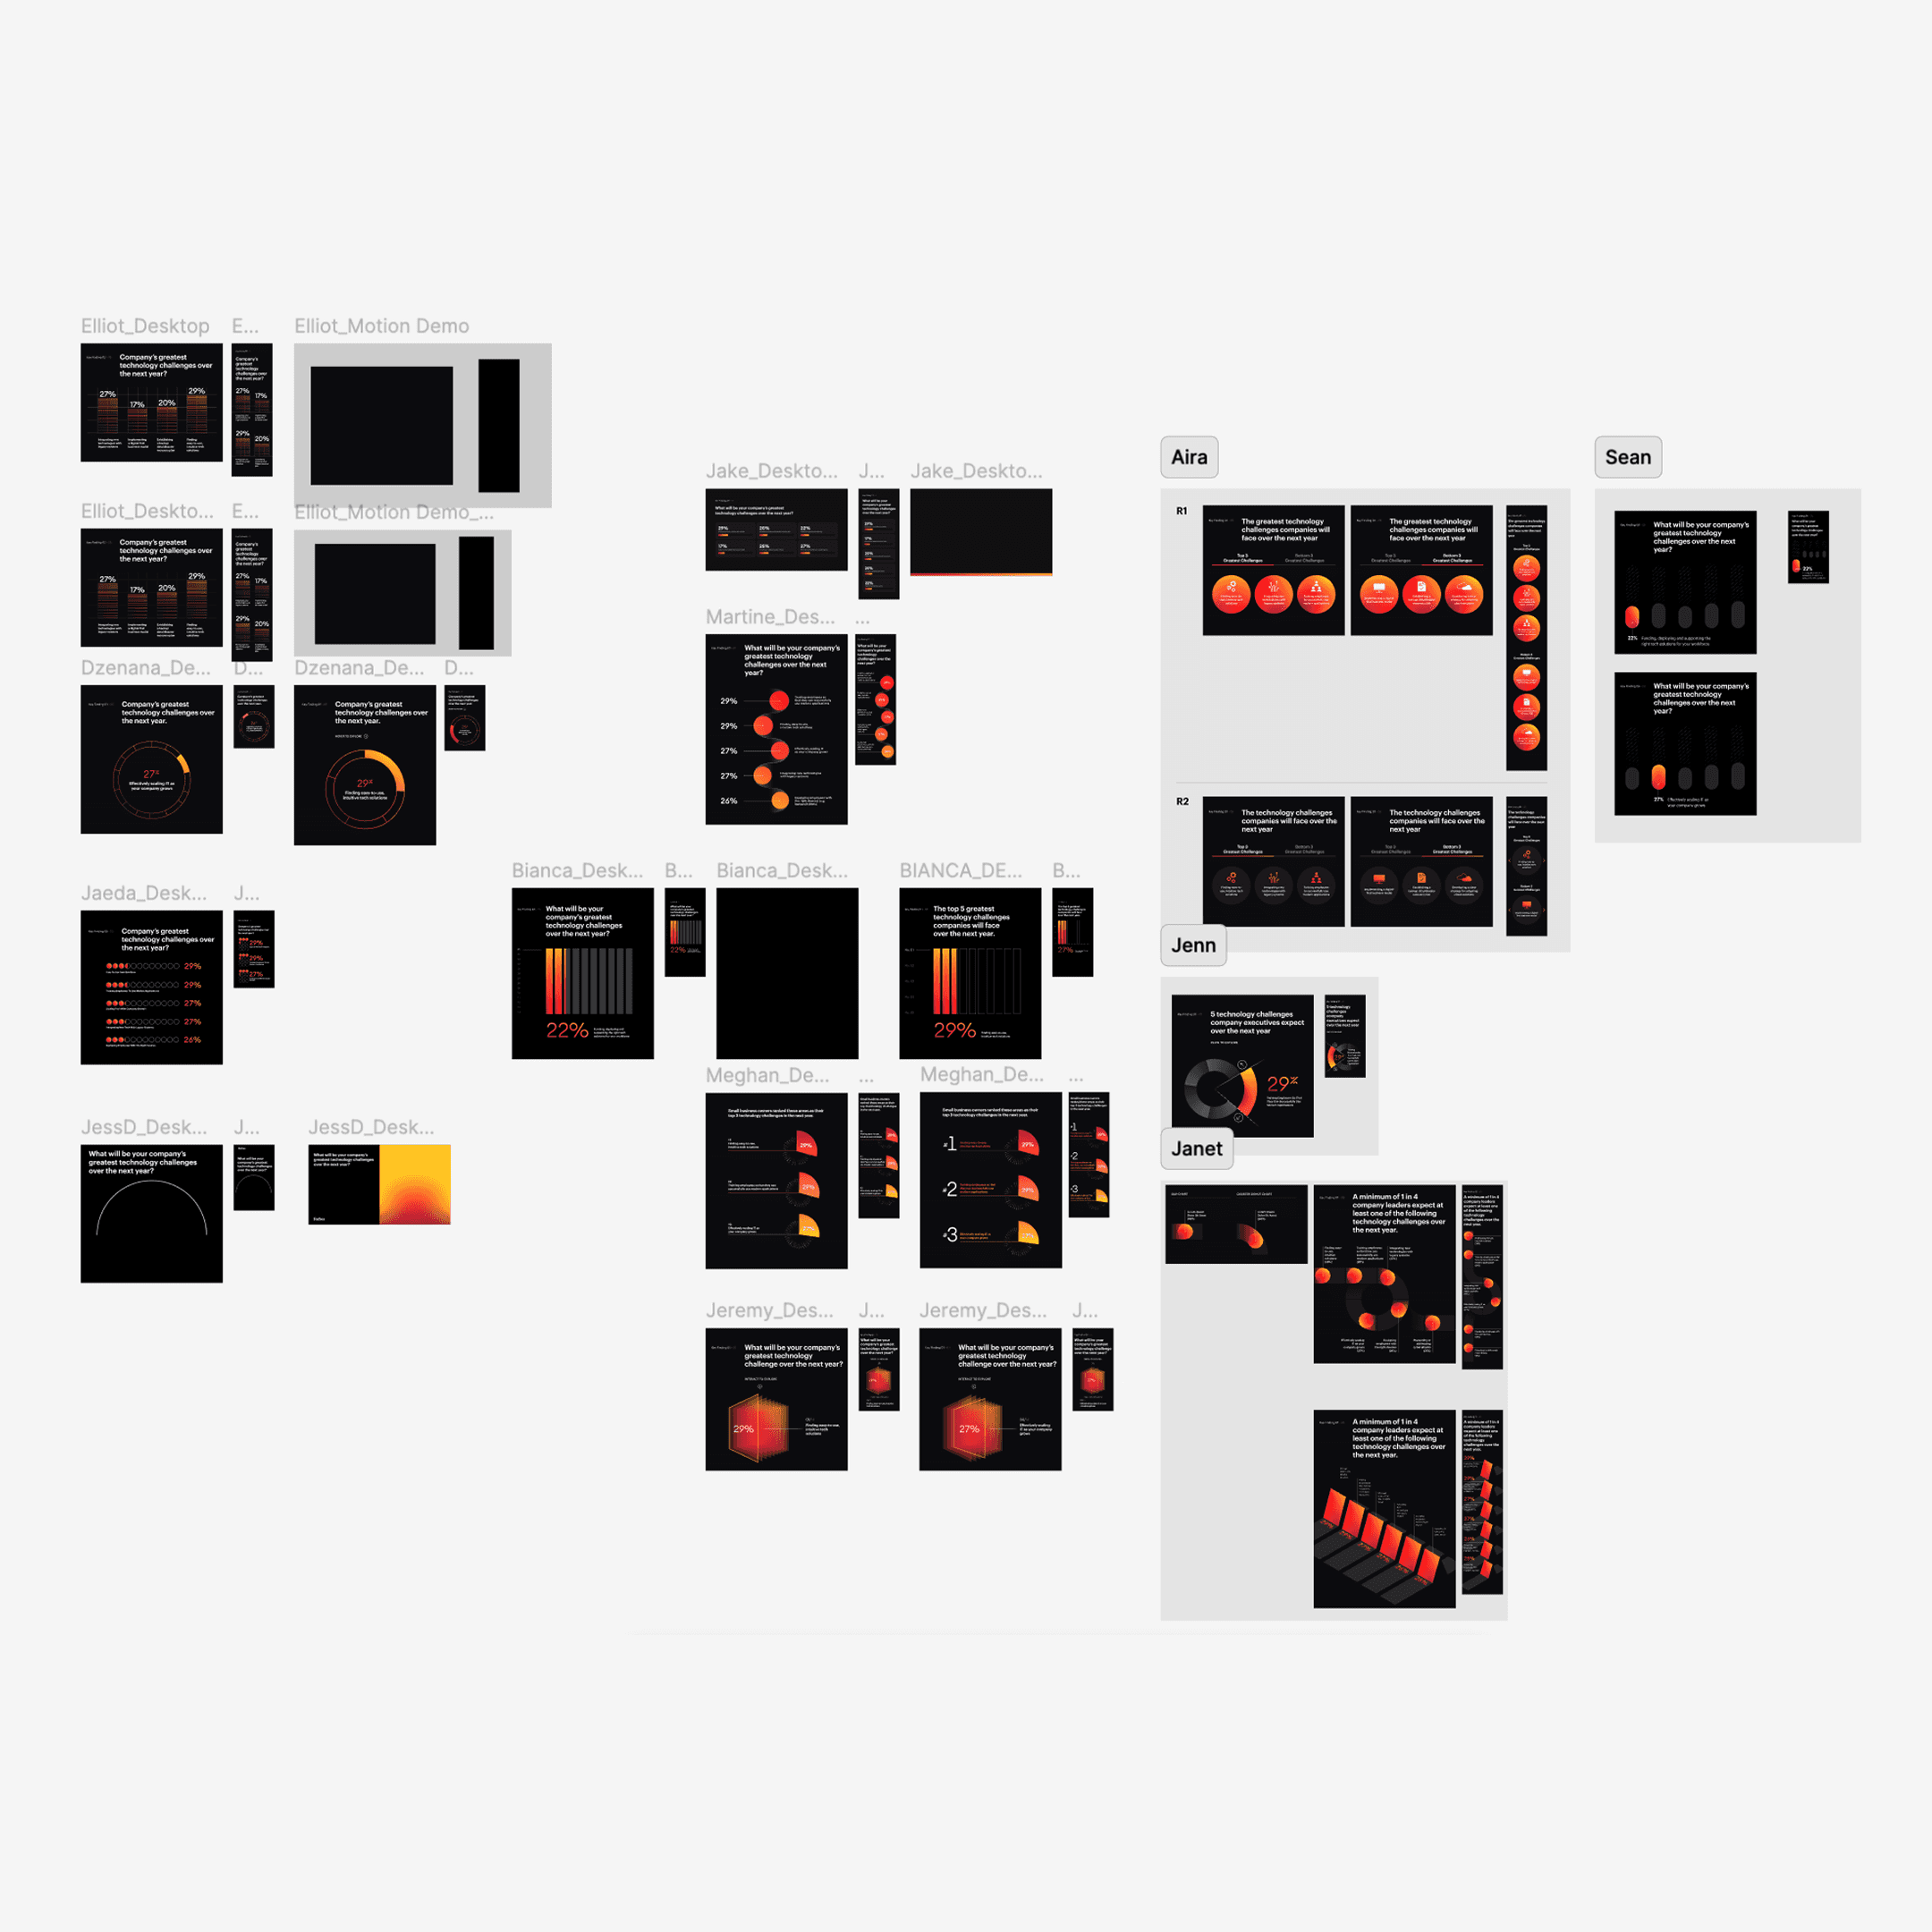
I led a sprint with 15 designers, with each one producing a data visualization using the emerging visual language. The sprint surfaced where the system needed to bend and revealed new patterns. The output became the foundation of the data viz library, a repeatable system the team could apply across every research surface that followed.
Data Visualization Design Sprint
Final Data Visualization Library